
Journal of the International Telemedicine Academy, Vol. 1, No. 2, pp. 33-41
Employing Fuzzy Logic to Processing of Loudness Scaling Test Results
Multimedia Systems Department, Gdansk University of Technology, Narutowicza 11/12, 80-952 Gdansk, Poland
pietka@sound.eti.pg.gda.pl
Abstract:
While fitting process of modern hearing aids hearing dynamics characteristics is required. The hearing dynamics characteristics is calculated on the basis of loudness scaling test results. The problem is that the loudness scaling test results are represented on a loudness category scale, but a hearing aid requires numerical parameters. A fuzzy logic method is the one of the simplest artificial intelligence methods which is useful for processing parameters expressed in a human natural language. In this article the fuzzy system for loudness scaling result processing is presented. Additionally, the method for shortening loudness scaling test is explained.
Introduction
The problem of hearing aid fitting includes many issues, but the most important one is the gain control problem. Generally, a hearing aid fitting process can be described as scaling of a wide-ranged dynamics of speech to a narrow-ranged dynamics of impaired hearing. To solve this problem, most of hearing aids use dynamics processors such as compressor and expander (fig. 1.1)[1][2][3].
To obtain a hearing dynamics (HD) characteristics, loudness scaling test (LST) results are needed. To asses loudness level natural language
is used, but a hearing equipment requires parameters on a numerical scale. For this reason human natural language processing methods are required. The processing methods usually base on artificial intelligence. Fuzzy logic is the one of the simplest artificial intelligence methods, which is especially useful in converting parameters expressed in a natural language to proper parameters on a numerical scale [4][5][6].
The article is dedicated to the use of fuzzy logic to LST results processing. When developing the fuzzy logic system (FS) the way to shortening of LST was elaborated. The details are presented in the following paragraphs.
Fig. 1.1. Hearing compensation model
The loudness scaling test rules
In clinical practice several types of LST are used. For the developed method was chosen a well-known LGOB method (Loudness Growth in ˝ Octave Bands). The LGOB rules are simply and easy to implement. Moreover the LGOB principles are similar to other commonly used LST like e.g the WHF (Wurzburger Horfeld) method, but from the author's point of view the LGOB test is easier to understand [7][8][9][10].
During the LGOB test a patient is listening to test signals which loudness level is changing randomly. The patient has to asses loudness sensation for each test signal using the seven point loudness category scale:
0. Nothing (the patient can't hear),
1. Very soft (the patient only detects a sound, but a loudness level is too low),
2. Soft (the patient can hear a sound, but she/he would like to listen to a louder sound),
3. Comfort (MCL) (a loudness level is comfort for the patient),
4. Loud (the patient can hear a sound, but she/he would like to listen to a lower sound level),
5. Very loud (the patient would like to definitely listen to a much lower sound level),
6. Too loud (a sound level makes pain).
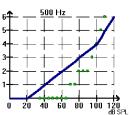
Test signals are in the white noise signal form filtered in four half octave bands with the middle frequencies: 500 Hz, 1000 Hz, 2000 Hz, 4000 Hz (fig. 2.1). Each test signal duration is 3 seconds and the signal's form is presented in fig. 2.2.
Fig. 2.1. Half octave band filters characteristics
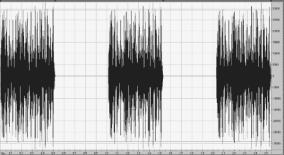
Fig. 2.2. The form of the test signal
The LST contains two phases. The first phase is a training phase. During this phase the hearing threshold and the uncomfortable level is measured. During the second phase test signals are presented in a random order. Each test signal is presented at least three times. Patient's responses are collected for each test signal. When the test is finished, a loudness scaling characteristics is determined. First, the median value of collected responses values for each test signal is collected. Next, for given frequency band the obtained median values are approximated by a curve. The obtained curves (for each examined frequency band and for each examined ear) describe loudness scaling characteristics (fig. 2.3).
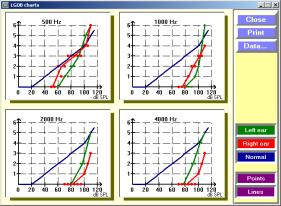
Fig. 2.3. Example of loudness scaling characteristics
Based on the LGOB principles a computer LST was implemented. The application works on PC computer and requires a 16 bit sound card. For examination, an earphones (e.g. ER 3A) and sound level calibration unit is also required. In this case the examination dynamic range is 30 - 110 dB SPL. The implemented LST was verified on normally hearing (NH) and hearing impaired (HI) persons and the obtained results were compared with the results obtained for the same persons using a dedicated ReSound P3 device. Although the ReSound device has wider dynamics range (20 - 120 dB), the obtained results were compatible [11][12].
The fuzzy logic system for loudness scaling processing
The LST results are presented as a loudness category scale vs. the input loudness level, but a hearing aid amplifier requires a characteristics in the form of the output loudness level as a function of the input one (fig. 3.1). It means that converting LST results from a loudness category scale to a numerical decibel scale, which output loudness level represents, is needed. In order to do this, the FS was designed.
![]()
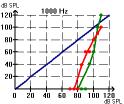
Fig. 3.1. The idea of obtaining a hearing dynamics characteristics.
The most suitable method for a converting category scale to numerical values is a fuzzy processing [5][6][12]. The developed FS requires data as follows:
- loudness scaling results for NH people - presented as input membership functions,
- loudness scaling results for a given patient - each loudness scaling result represents a vector of three parameters (test signal loudness level, frequency band, selected loudness category),
- knowledge concerning interpretation of difference between results obtained for the examinee and NH people ( a fuzzy logic rules base).
- output membership functions, which describe all possible differences between the examinee and NH people loudness scaling results.
One of the most important information for the developed FS is the knowledge of LST results for NH people. This knowledge is represented in the FS by input membership functions. Because seven loudness categories are used in the LST, seven fuzzy sets per each frequency band were defined. Each fuzzy set is described by one membership function. In order to obtain these functions, about 51 NH students were examined. The details of obtained membership functions are presented in paragraph 4.
Comparing the LST results on a seven point scale, 13 kinds of differences can be defined:
- six positive differences (when the current LST result is greater than the proper result for a NH person),
- six negative differences (when the current LST result is smaller than the proper result for a NH person),
- no difference (when the current LST result is equal to the proper result for a NH person).
Both the negative and positive difference means hearing impairment, but in addition - positive differences usually denote a loudness recruitment problem. On the basis of these differences thirteen output membership functions were created (fig. 3.2) [13][14].
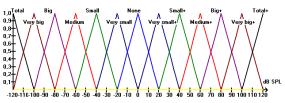
Fig. 3.2 Output membership functions
An appropriate fuzzy processing based on rules was defined in the fuzzy rules base (FR). A typical form of the FR base is as follows:
IF <input1> AND <input2> AND & AND <inputn> THEN decision
In this case two input variables were defined:
- Norm - represents the LST results for NH person,
- Exam - represents the LST results for the currently being examined person.
Because each variable uses the same loudness category scale, the variable which represents an examinee, uses labels written in capital letters. In the developed FS the simply FR base was defined (fig. 3.3). If for the same test signal LST results for the examinee and NH people are the same, the FS activates a rule with the output label "no difference". If such a difference is equal to one category, the FS activates a rule with the output labelled as "very small". If the difference equals two categories, the FS activates a rule with the output labelled as "small", etc. Experts from The Institute of Hearing Physiology and Pathology in Warsaw checked the rules.
Fig. 3.3. The rules base
As LST results are collected, the FS is ready for calculation of HD characteristics. As was mentioned, each LST result is represented by a three parameter vector which contains: test signal level, frequency band and loudness category, all given for this signal. In the FuzzyLGOB block (fig. 3.4), each LST result is processed as follows:
- First, the FS executes fuzzyfication process. It means that numerical input data are converted to a category domain. In this case, the test signal level and frequency band parameters are fuzzyfied according to the obtained input membership functions which describe the normally hearing loudness scaling results. The third parameter - the loudness category has already been in the fuzzy domain, but from the formal point of view it has to be fuzzyfied, too. For this case, the system uses fuzzyfication based on so called singletons [4][5][15].
- After the fuzzyfication process, the system starts to process rules. For each activated rule, the system calculates the rule strength.
- Next, these strength values for the rules activate adequate output membership functions and in result an output function is created (fig. 3.5)
- Finally, the system starts the defuzzyfication process, in which the centre of gravity for the created output function is calculated. The obtained value represents the difference on the dB scale between the hearing scaling results for the NH person and the examinee. The output level value is computed as the sum of the input test signal level and the obtained difference.
Fig. 3.4. The block diagram of the designed fuzzy system
Next, the system collects the processed LST results and creates an expected characteristics of the HD by approximating these results.
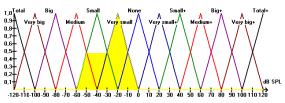
Fig. 3.5. An example of obtained output function
The estimation process of membership functions
In the fuzzy logic, membership functions usually assume a triangular or trapezoidal shape, rarely a sigmoidal shape or Gauss curves. A FS with triangular or trapezoidal functions is easier to analyse and implement [4][5].
Typically, membership functions are created on the basis of expert's knowledge. The knowledge can be explored directly from experts or indirectly on the basis of statistical analysis results. In the case of statistical analysis a statistical distribution has to be assumed first. If the distribution is unknown the normal one is assumed. Next, the minimal number of tests has to be estimate. To order this the Pearson's statistics (4.1) was calculated. As the results of Pearson's statistics it was estimated that at least 40 persons are required for examination. The Pearson's test can be useful in astatistical hypothesis verification process only if for each j Npj>=10 or nj>=5 [16].
![]() (1)
(1)
where:
x - random variable;
F - distribution of a random variable
F(a) = 0, F(b) = 1, a = a0< a1 < a2 <&< ak = b and pi = P{ai-1<x<=ai}, i=1,2,...
ni = number of elemnts x, which fulfill the condition ai-1<x<=ai;
 - impact probability of random variable X in the
interval i;
- impact probability of random variable X in the
interval i;
ri - the minimum value in the interval i;
N - total number of observations.
During the FS developing 51 NH students were examined. The examined group consisted of persons in the ages twenty - twenty five, who had been experienced in subjective tests. The results obtained with the examined group are shown in fig. 4.1.
Fig. 4.1. The obtained membership functions which describe a loudness scaling for normally hearing persons
The next step in the course of the FS development was to find the shape of membership functions, which in the best way approximates LST results. Very important assumption was that membership function keeps features of the probability density function (4.2). During the calculation process two kind of functions were taken into consideration: the Gauss function (normal distribution function)(4.3) and trapezoid functions (4.4) [5][15].
 (2)
(2)
where p(x) - probability density function
As was mentioned, the normal distribution function is assumed if the proper one is unknown, however the Gauss function never reaches the zero value. In the FS case, it means that each element belongs to all fuzzy set (all fuzzy sets overlap each other). In consequence, a FS works more hard, because each time every rule is activated and thus a defuzzyfication procedure is more complicated. The example of obtained membership functions in the Gauss function form is shown in fig. 4.2.
 (3)
(3)
where:
s - dispersion
m - average value;
Fig. 4.2. Example of membership functions approximation with normal distribution functions
The most expected membership function shape is trapezoid. This kind of function requires only four parameters (trapezoid vertexes). In a particular case trapezoid can be reduced into a triangle. Examples of obtained membership functions in the trapezoid form are shown in fig. 4.3.
Fig. 4.3. Example of membership functions approximation with trapezoid functions
When comparing the Pearson test results for the Gauss shape and trapezoid shape of membership functions it can be concluded that trapezoid membership functions are better than Gauss functions. Table 4.1 contains some exemplary of the Pearsons test results for trapezoid and Gauss functions. A smaller value of the Pearson test result denotes a better approximation result.
Table 4.1 The Pearson test results for Gauss and trapezoid membership functions - 1000 Hz
| loudness category | "0" | "1" | "2" | "3" | "4" | "5" | "6" |
|---|---|---|---|---|---|---|---|
| Trapezoid function | 0,124 | 3,66 | 1,807 | 2,169 | 0,546 | 0,147 | 0,001 |
| Gauss function | 29,818 | 179,513 | 11,532 | 10,393 | 11,051 | 22,568 | 0,241 |
Results of the loudness scaling test based on fuzzy logic processing
The first step in the verification process of the designed method for LST results processing was to check correctness of the obtained HD characteristics. In this case, the obtained characteristics were compared with the characteristics calculated with standard method based on an average LST results for NH people. The comparison has shown that the HD characteristics obtained in the basis of the designed fuzzyLGOB converter are in accordance with expected results, which is shown by an example in figure 5.1 and table 5.1.
![]()
Fig. 5.1. An example of loudness scaling test results and it's corresponding hearing aid dynamics characteristics
Table 5.1. The comparison of loudness scaling test results processing in the standard method and in the fuzzyLGOB converter
|
Test signal level [dB] |
The standard method [dB] |
The fuzzyLGOB converter [dB] |
|---|---|---|
| 35 | 20 | 20,79 |
| 40 | 20 | 20 |
| 45 | 20 | 19,21 |
| 50 | 20 | 20 |
| 55 | 20 | 20,79 |
| 60 | 20 | 20 |
| 65 | 20 | 19,21 |
| 70 | 40 | 40 |
| 75 | 40 | 40,79 |
| 80 | 60 | 60 |
| 85 | 60 | 59,21 |
| 90 | 60 | 60 |
| 95 | 80 | 80,79 |
| 100 | 100 | 100 |
| 105 | 110 | 110 |
| 110 | 120 | 120 |
The main inconvenience of the LST is its long duration. On the assumption that:
- each test signal duration approximates 3 seconds,
- number of frequency bands is 4,
- number of trials is 3,
- test signal amplitude changes from 30 dB SPL to 110 dB SPL with 5 dB step.
The average test duration can be even 10 minutes per ear (eq. 5.1). Too long test duration makes a patient tired and has bad influence on results. This was the reason to find out the way to shorten the test duration and to save results reliability.
![]() (4)
(4)
where:
T - total time of LST
f - number of bands,
p - number of trials,
t - test signal duration,
LMAX - maximum level [dB],
LMIN - minimum level [dB],
s - amplitude changing step;
The most intuitive idea is to cut down the number of test signals. In this case, could be selected only the one characteristic test signal per each loudness category. In this way during the test could be used only seven different test signals per each frequency band. In this case the test duration could be shorten to about 4 minutes per ear (more than twice shorter) what is presented by expression 5.2.
![]() (6)
(6)
where:
T' - total time of the shortened LST,
f - number of bands,
p - number of trials,
t - test signal duration,
K - loudness categories number
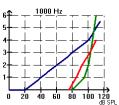
The test signal level which corresponds to the membership function maximum value is a good candidate for a selected test signal (fig. 5.2). It means that loudness level of these test signals were distinguish in the best way by NH people.
The designed shortened loudness scaling test (sLST) was verified. In the verification process took part group of twenty normal hearing students and three HI persons. First the normal hearing students have been examined with the standard LST and a few minutes later each of them done the shortened LST. During the tests time was measured. Comparing test results it can be observed that obtained loudness scaling characteristics in shortened mode are very similar to results gathered in standard mode (fig. 5.3). The table 5.2. shows examples of measured time during LST. The times achieved in shortened mode of LST are more or less twice shorter than in standard mode.
Fig. 5.2. An example of selected test signals for shortened loudness scaling test.
Fig. 5.3. Examples of loudness scaling results obtained in standard and shortened mode for normal hearing students
Table 5.2. Examples of loudness scaling tests duration
| No |
Standard LGOB test [min] |
Shortened LGOB test [min] |
|---|---|---|
| 1 | 9,5 | 6,5 |
| 2 | 8,5 | 4,5 |
| 3 | 7 | 4 |
| ... | ... | ... |
| 20 | 9 | 5,5 |
In the HI person case, each type of LST was repeated several times. Aim of these examinations was to check how is changing the loudness scaling characteristics for the patient in period time (on average about two weeks). Figure 5.4 presents examples of LST results collected within two weeks. The solid lines represent results obtained in the standard mode and the dashed lines represents results obtained in shortened mode. It can be observed that the loudness scaling characteristics obtained in standard mode is changed in the similar way as the one obtained in shortened mode.
Fig. 5.4. Examples of loudness scaling results obtained in two loudness scaling test modes for the same hearing impaired person, the solid line - standard test LGOB, the dashed line - shortened LGOB test.
In this case test time was also measured (tab. 5.3). The proportion between duration of the standard mode and the shortened mode is the same as in the normal hearing people case. It can be observed that LST in HI person case consumes less time, because of narrower examination dynamics range.
Table 5.3. Examples of loudness scaling tests duration in the hearing impaired person case
| No. |
Standard LGOB test [min] |
Shortened LGOB test [min] |
|---|---|---|
| 1 | 5,5 | 3 |
| 2 | 7,5 | 3,5 |
| 3 | 6 | 3 |
Conclusions
Utilizing fuzzy logic for processing of LST results it has been approached two purposes:
- flexible and effective method for calculating HD characteristics was designed,
- the shortened LGOB test was created.
The designed fuzzyLGOB converter allows calculating precisely a HD characteristic which is useful for both making hearing impairment approximate simulation and for hearing aid fitting. From formal point of view utilizing the artificial intelligence method for processing of loudness scaling test results, expressed in loudness categories, is more correct than approximate calculation of HD characteristics in the basis of average results for NH people. The designed method is easy to implement and can be update to other frequency bands or different loudness category scale.
Additionally in the basis of statistical analysis of loudness scaling results for NH people it has been became possible to shorten the LST duration more or less twice. It means that in much shorter time it is possible to obtain the reliable HD characteristics.
References
- Czyżewski A, Kostek B, Suchomski P: Automatic Assesment of the Hearing Aid Dynamics Based on Fuzzy Logic, 3rd IASTED International Conference Artificial Intelligence and Applications, Benalmadena, 2003.
- Skinner MW: Hearing Aid Evaluation, Prentice-Hall, New Jersey, 1988.
- Valente M: Hearing Aids: Standards, Options and Limitations, Thieme Medical Publishers, Inc., New York, 1995.
- Zadeh LA: Fuzzy Sets, Information and control, 1965, 338-353.
- Kosko B: Fuzzy Engineering, Prentice-Hall, 1997.
- Kostek B: Soft Computing in Acoustics, Applications of Neural Networks, Fuzzy Logic and Rough Sets to Musical Acoustics, Studies in Fuzziness and Soft Computing, Physica Verlag, Heilderberg, New York, 1999.
- Allen JB, Hall JL, Jeng PS: Loudness growth in 1/2-octave bands (LGOB) - A procedure for the assessment of loudness, J. Acoust. Soc. Am. 88, No. 2, 1990.
- Ellis MR, Wynne MK: Measurements of Loudness Growth in 1/2-Octave Bands for Children and Adults With Normal Hearing, American Journal of Audiology 8, 1999.
- Kiessling J: Loudness Growth In Sensorineural Hearing Loss - Consequences For Hearing Aid Design and Fitting, Audiol. Akustik 34:82-89, 1995.
- Pluvinage V: Clinical measurement of loudness growth, Resound Corp. Redwood City, CA.
- Suchomski P, Kostek B: Badanie dynamiki słuchu przy wykorzystaniu komputera PC, OSA 2001, Wrocław, 103 - 109 (in polish).
- Suchomski P, Metodyka i system dopasowania protez słuchu w oparciu o badanie percepcji sygnału mowy w szumie, rozprawa doktorska, Gdańsk, 2005 (in polish).
- Gelfand A Stanley, Essential of Audiology, Thieme, New York, 1997.
- Wyrsch S, Kaelin A: A DSP Implementation of a Digital Hearing Aid With Recruitment of Loudness Compensation and Acoustic Echo Cancellation, Workshop on Applications of Signal Processing to Audio and Acoustics IEEE ASSP, pp. 4, 1997.
- Mendel JM: Fuzzy Logic Systems for Engineering: A Tutorial, IEEE, 1995.
- Sobczak W: Podstawy probabilistyczne teorii systemów informacyjnych, WNT, Warszawa 1981 (in polish).